書いたので。
# モジュールのインポート
%matplotlib inline
from math import floor
from itertools import product
import numpy as np
import matplotlib.pyplot as plt
シンプルなノイズ
格子点ごとにランダムに値を割り振って、一般の座標における値を線形補間で求めるノイズを考える。
パーリンノイズのコードが多少複雑になるので、このノイズのコードもクラスを使って書く。
なおランダムな値を格子点に割り振るときには {{{blog-post(posts/random_pick, この記事) で紹介したハッシュ法を使った。
def lerp(a, b, t):
    return a + (b - a) * t

class Simple():
    weights = np.random.random(256)
    rand_index = np.zeros(512, dtype=np.int8)
    for i, rand in enumerate(np.random.permutation(256)):
      rand_index[i] = rand
      rand_index[i + 256] = rand

    @staticmethod
    def hash(i, j):
        return Simple.rand_index[Simple.rand_index[i] + j]

    # 点の周りの格子点の線形補間を求める
    @staticmethod
    def noise(x, y):
        ix = floor(x) % 256
        iy = floor(y) % 256
        dx = x - floor(x)
        dy = y - floor(y)
        y0 = lerp(Simple.weights[Simple.hash(ix,         iy)],
                  Simple.weights[Simple.hash(ix + 1,     iy)], dx)
        y1 = lerp(Simple.weights[Simple.hash(ix,     iy + 1)],
                  Simple.weights[Simple.hash(ix + 1, iy + 1)], dx)
        return lerp(y0, y1, dy)

# 画像の大きさは(512, 512)
width, height = 512, 512
canvas = np.zeros((width, height))
# 格子点を16個配置する
w = 16
canvas = np.array([[Simple.noise(x, y)
                    for x in np.linspace(0, w, width)]
                   for y in np.linspace(0, w, height)])

# matplotlibを使って表示
fig, ax = plt.subplots(figsize=(10, 10))
ax.imshow(canvas, cmap=plt.cm.binary)
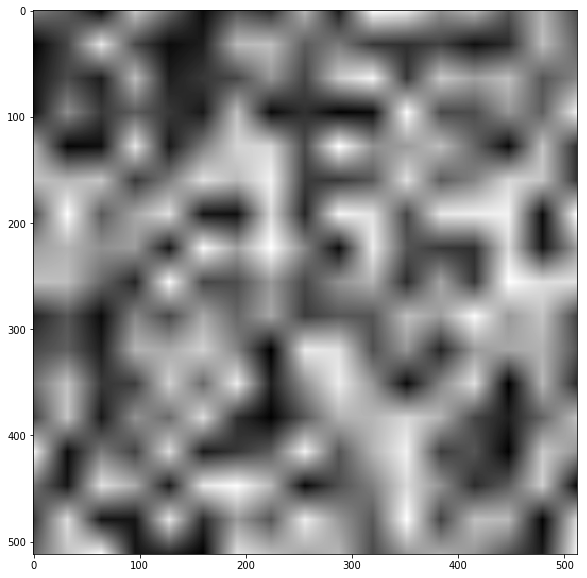
この場合、元になった格子が目立ってノイズっぽくならない。
パーリンノイズ
パーリンノイズを使うと自然なノイズを高速に作れる。
パーリンノイズの工夫を挙げると
- 格子点に割り振るのは重みではなく勾配ベクトル \(\vec{a}_{ij}\)
- 格子点の重みは固定ではなく、計算している座標 \((x, y)\) から求める
- \(noise(x, y)\) 計算するとき、格子点 \(i, j\) の重みは \((i-x, j-x) \cdot \vec{a}_{ij}\)
- 格子の端で値が急に変化するのを避けるために、\((x, y)\)の小数部分を
fade 関数にかけてから線形補間をする
がある。勾配ベクトルとの内積使って重みを求めることで格子点の周りでも値が散らばるようになり、ノイズが自然になる。
class Perlin():
    slopes = 2 * np.random.random((256, 2)) - 1
    rand_index = np.zeros(512, dtype=np.int8)
    for i, rand in enumerate(np.random.permutation(256)):
      rand_index[i] = rand
      rand_index[i + 256] = rand

    @staticmethod
    def hash(i, j):
        # 前提条件: 0 <= i, j <= 256
        return Perlin.rand_index[Perlin.rand_index[i] + j]

    @staticmethod
    def fade(x):
        return 6 * x**5 - 15 * x ** 4 + 10 * x**3

    @staticmethod
    def weight(ix, iy, dx, dy):
        # 格子点(ix, iy)に対する(ix + dx, iy + dy)の重みを求める
        ix %= 256
        iy %= 256
        ax, ay = Perlin.slopes[Perlin.hash(ix, iy)]
        return ax * dx + ay * dy

    @staticmethod
    def noise(x, y):
        ix = floor(x)
        iy = floor(y)
        dx = x - floor(x)
        dy = y - floor(y)

        # 重みを求める
        w00 = Perlin.weight(ix,     iy,   dx  , dy)
        w10 = Perlin.weight(ix+1,   iy, dx-1,   dy)
        w01 = Perlin.weight(ix,   iy+1,   dx, dy-1)
        w11 = Perlin.weight(ix+1, iy+1, dx-1, dy-1)

        # 小数部分を変換する
        wx = Perlin.fade(dx)
        wy = Perlin.fade(dy)

        # 線形補間して返す
        y0 = lerp(w00, w10, wx)
        y1 = lerp(w01, w11, wx)
        return (lerp(y0, y1, wy) - 1) / 2 # 値域を[0, 1]に戻す


# 画像の大きさは512x512
width, height = 512, 512
canvas = np.zeros((width, height))
# 格子点を16個配置する
w = 16
canvas = np.array([[Perlin.noise(x, y)
                    for x in np.linspace(0, w, width)]
                   for y in np.linspace(0, w, height)])

# matplotlibを使って表示
fig, ax = plt.subplots(figsize=(10, 10))
ax.imshow(canvas, cmap=plt.cm.binary)
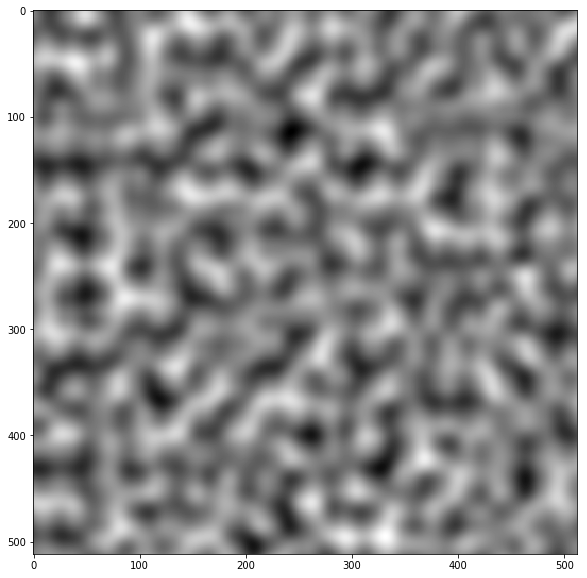
計算に用いた格子がどこにあるのか分からなくなって、ノイズらしいノイズになる。
fade 関数もプロットしておく。
fig, ax = plt.subplots(figsize=(5, 5))
ax.plot(np.linspace(0, 1, 100), fade(np.linspace(0, 1, 100)), label="fade(x)")
ax.grid()
ax.legend()
fig
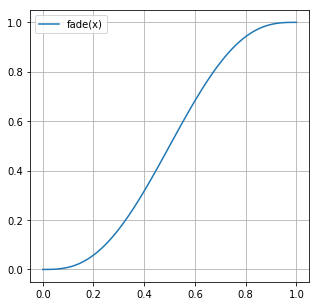
この関数は \(x = 0, 1\) で一階、二階の微分係数が0になる。
そのため、値を隣の格子と滑らかにつなげることができる。
画像を作るときの w の値を変化させればノイズの粗さを変えることができる。
fig, axes = plt.subplots(nrows=3, ncols=2, figsize=(20, 30))

width, height = 512, 512
canvas = np.zeros((width, height))
for i, j in product([0, 1, 2], [0, 1]):
  # wの値を2のべきにする
  w = 2**(i*2 + j)
  canvas = np.array([[Perlin.noise(x, y)
                      for x in np.linspace(0, w, width)]
                     for y in np.linspace(0, w, height)])
  axes[i, j].set_title("w = " + str(w))
  axes[i, j].imshow(canvas, cmap=plt.cm.binary)
fig
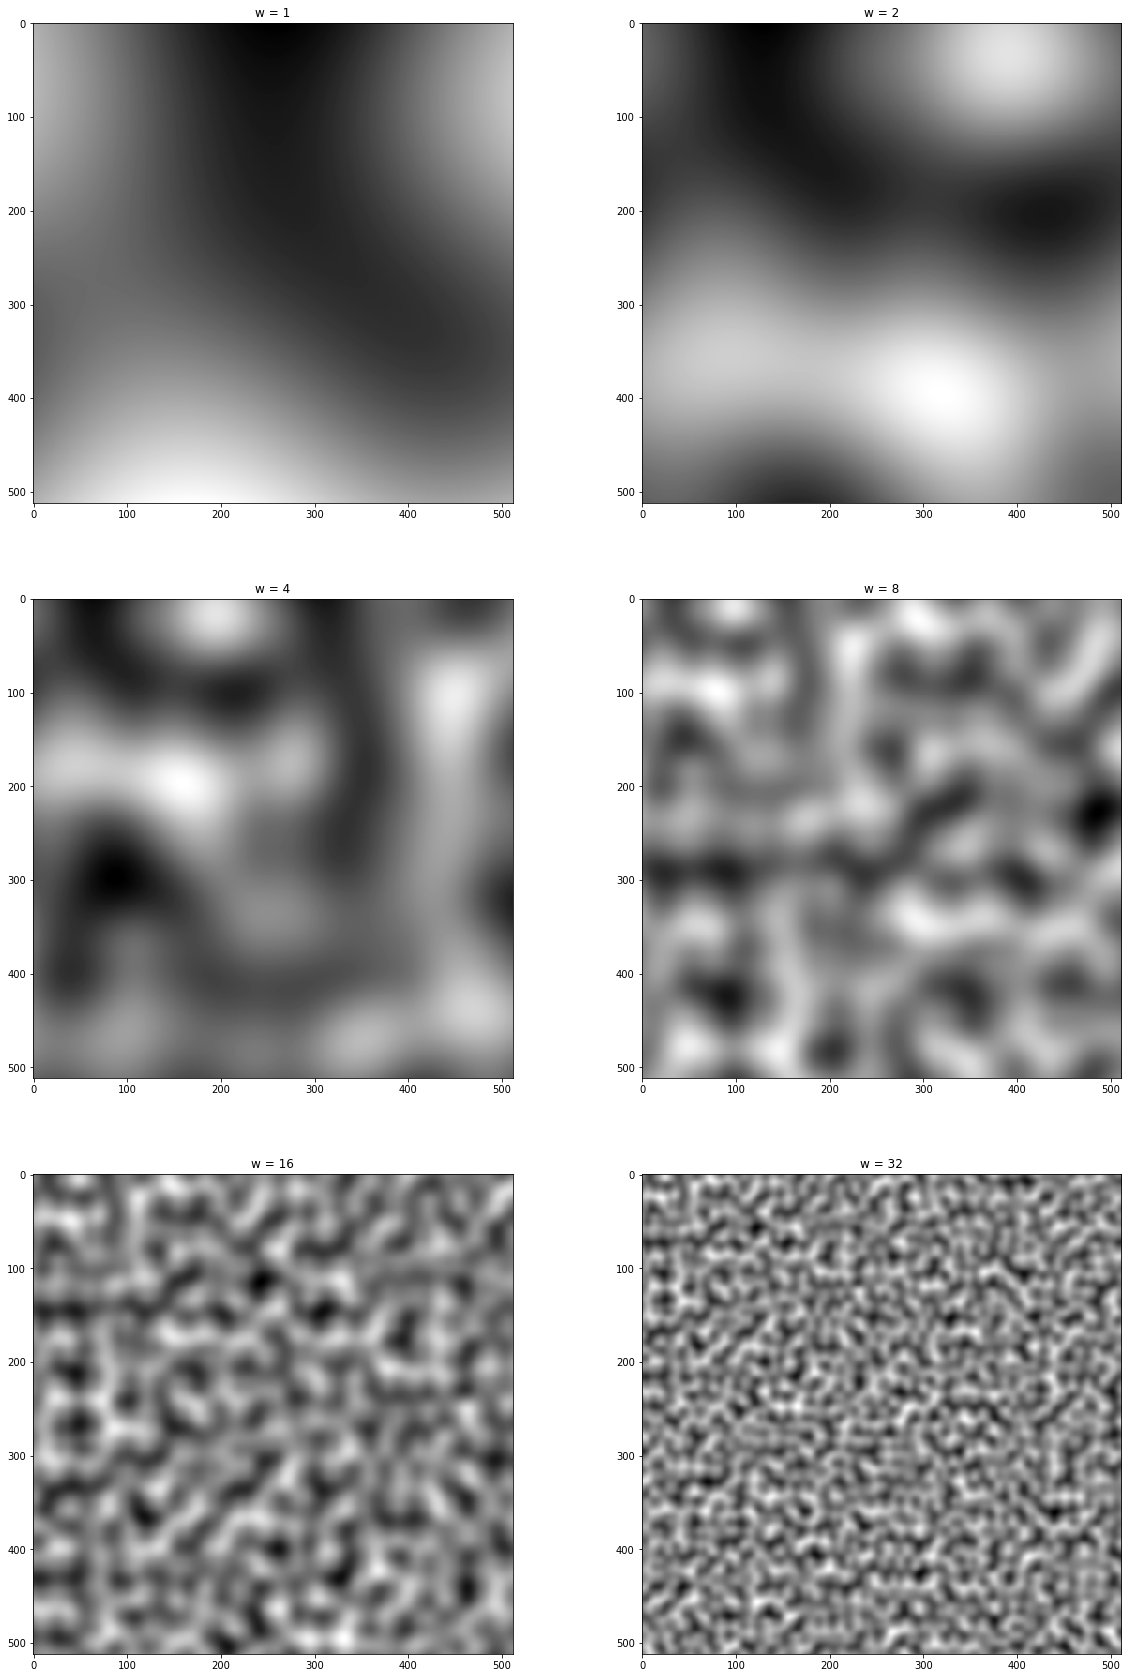
w の値にかかわらずそれらしいノイズが生成されている。
Ken Perlinの元論文を読むと勾配ベクトルを整数のみにして高速化する方法や
パーリンノイズを元にして別のノイズを作る方法も乗っているがこれはまた今度にする。
参考文献
Physically Based Rendering, Third Edition, 10.6.1 “Perlin Noise”
http://ai2-s2-pdfs.s3.amazonaws.com/e04d/7772b91a83a901408eb0876bbb7814b1d4b5.pdf
http://mrl.nyu.edu/~perlin/noise/
ある分布が与えられたときにその分布に従う乱数を生成することを考える。
理論
事実
確率分布\(X\)が確率密度関数\({\it pdf }(x)\)で与えられたとする。
つまり、\(X\)から変数をランダムにとったとき\(x\)が選ばれる確率は\({\it pdf} (x)\)に比例し、かつ
\[
\int_{-\infty}^{\infty} {\it pdf }(x) dx = 1
\]
が成り立つとする。
この仮定のもとで、\({\it pdf}(x)\)の累積分布関数(commulative distribution function)を
\[
{\it cdf}(x) = \int_{-\infty}^{x} {\it pdf }(x) dx
\]
とする。
このとき、\(x\)を\([0, 1]\)の一様分布からとった変数とすると、\({\it cdf}^{-1}(x)\)は\(P\)に従う。
言い換えると、\(Y\)を\([0, 1]\)の一様分布としたとき、\(X \sim {\it cdf}^{-1}(Y)\)が成り立つ。
証明
\(x\)を\([0, 1]\)の一様分布からとった変数とすると、任意の\(a \in [0, 1]\)に対して
\[
P(x \le a) = a
\]
である。
よって、与えられた\({\it pdf}(x)\)から計算した\({\it cdf}(x)\)について、
\[
P({\it cdf}^{-1}(x) \le {\it cdf}^{-1}(a)) = a
\]
が成り立つ。
\({\it cdf}^{-1}(a) = y\)とすると、\(a = {\it cdf}(y)\)でもあるから
\[
P({\it cdf}^{-1}(x) \le y) = {\it cdf}(y)
\]
となる。
\(\therefore\) \({\it cdf}^{-1}(x)\)は累積分布関数が\({\it cdf}\)であるような分布、すなわち\(X\)に従う。 \(\Box\)
(私は確率論をきちんと学んでいないので、この証明がどれぐらい正しいのか知らない。)
Physically Based Rendering, Third Edition の 753-754ページには、離散分布を使った直感的でわかりやすい説明が載っていた。
実装
pythonでは random.random() を使うと \([0,1]\) の一様分布が得られるので、上で示した方法を使えば様々な分布に従う乱数を生成できる。実際にやってみる。
# モジュールのインポート
%matplotlib inline
import random
from math import sin, cos, exp, log
import numpy as np
import matplotlib.pyplot as plt
一様分布
\([a, b]\)の一様分布では \({\it pdf}(x)\) は (\(x \in [a,b]\) で)一定となる。
\({\it pdf}(x)\)の定義から\( \int_{a}^{b} {\it pdf}(x) dx = 1\)が成り立つので
\[
{\it pdf}(x) = \frac{1}{b-a}
\]
となる。(本当は\(x \notin [a, b]\)のときも考えなくてはいけないが、 \({\it pdf}(x)=0\)であり \({\it cdf}(x)\)の形も自明なので省略することにする。以降の例でも同様。)
これから、
\[
{\it cdf}(x) = \int_{-\infty}^{x} {\it pdf}(x) dx = \frac{x-a}{b-a}
\]
\[
\therefore {\it cdf}^{-1} (x) = (b-a)x + a
\]
となる。
これをコードにすると、以下のようになる。
# [0, 1]の一様乱数を入力すると[a, b]の一様乱数を出力する関数を返す
def RNG_uniform(a, b):
    def cdf_inv(x):
        return (b - a) * x + a
    return cdf_inv
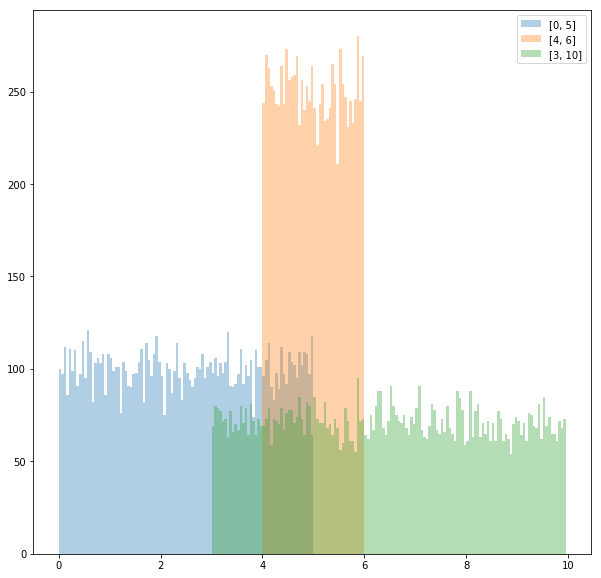
グラフにプロットすれば、本当に関数の出力が一様乱数か確認できる。
fig, ax = plt.subplots(figsize=(10, 10))
bins = list(np.arange(0, 10, 0.05))
# a, bの値を変えて3つ描画する
ax.hist([RNG_uniform(0, 5)(random.random()) for _ in range(30000)], bins=bins, alpha=0.35, label="[0, 5]")
ax.hist([RNG_uniform(4, 6)(random.random()) for _ in range(30000)], bins=bins, alpha=0.35, label="[4, 6]")
ax.hist([RNG_uniform(3, 10)(random.random()) for _ in range(30000)], bins=bins, alpha=0.35, label="[3, 10]")
ax.legend()
fig
\({\it pdf}(x)\) が \(x\) に比例する分布
これはどのような分布かというと、変数 \(x\) を取ったとき\(x\) が \([0,1]\) に含まれる確率は \([1,2]\) に含まれる確率の半分となる分布である。
このような分布で、変数の範囲が \([a, b]\)であるものを考える。
\({\it pdf}(x) = cx\) とすると、\({\it pdf}(x)\) の条件
\[\int_{-\infty}^{\infty} {\it pdf }(x) dx = 1\]
から、
\[\int_{a}^{b} cx dx = \frac{c}{2} (b^{2} - a^{2}) = 1\]
\[\therefore c = \frac{2}{b^{2} - a^{2}}\]
よって
\begin{align}
{\it cdf}(x) & = \int_{-\infty}^{x} {\it pdf}(x) dx \\
& = \int_{a}^{x} \frac{2x}{b^{2} - a^{2}} dx \\
& = \frac{x^{2} - a^{2}}{b^{2} - a^{2}}
\end{align}
これより
\[
{\it cdf}^{-1}(x) = \sqrt{(b^{2} - a^{2}) x + b^{2}}
\]
これをコードにすると以下のようになる。
# [0, 1]の一様乱数を入力するとpdf(x)=cx (a < x < b) な乱数を返す関数を返す
def RNG_linear(a, b):
    def func(x):
        return ((b**2 - a**2)*x + a**2)**0.5
    return func
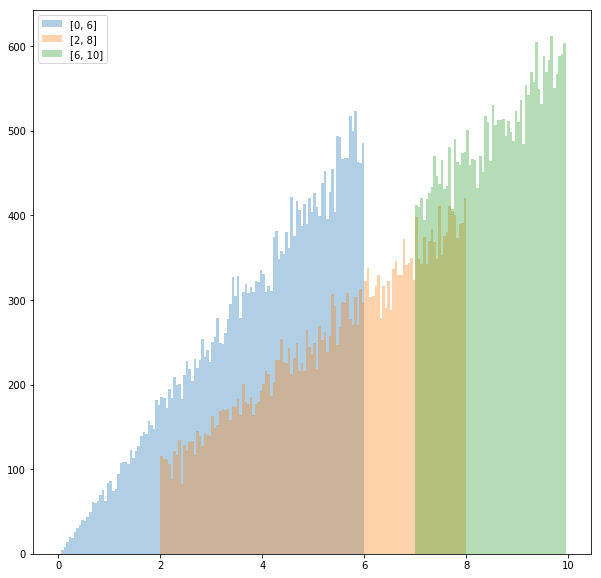
同様にグラフにする。
fig, ax = plt.subplots(figsize=(10, 10))
bins = list(np.arange(0, 10, 0.05))
# a, bの値を変えて3つ描画する
ax.hist([RNG_linear(0, 6)(random.random()) for _ in range(30000)], bins=bins, alpha=0.35, label="[0, 6]")
ax.hist([RNG_linear(2, 8)(random.random()) for _ in range(30000)], bins=bins, alpha=0.35, label="[2, 8]")
ax.hist([RNG_linear(7, 10)(random.random()) for _ in range(30000)], bins=bins, alpha=0.35, label="[7, 10]")
ax.legend()
fig
ここまでの二つの例における \({\it cdf}^{-1}(x)\)の形を見比べればわかるとおり、これらの考え方は\({\it pdf}(x) = cx^{n}\) の場合に一般化することができる。
指数分布
\({\it pdf}(x) = ce^{-kx}\) で、変数の範囲が \([a, b]\) とする。
\({\it pdf}(x)\)の条件から
\[\int_{a}^{b} ce^{-kx} dx = \frac{c}{k} (e^{-ka} - e^{-kb}) = 1\]
\[\therefore c = \frac{k}{e^{-ka}-e^{-kb}}\]
よって
\begin{align}
{\it cdf}(x) & = \int_{a}^{x} \frac{k}{(e^{-ka} - e^{-kb})}e^{-kx} dx \\
& = \frac{e^{-ka}-e^{-kx}}{e^{-ka} - e^{-kb}}
\end{align}
\[\therefore {\it cdf}^{-1}(x) = - \frac{\log(e^{-ka} - (e^{-ka} - e^{-kb})x)}{k}\]
コードは
# [0, 1]の一様乱数を入力するとpdf(x)=ce^(-kx) (a < x < b) な乱数を返す関数を返す
def RNG_exp(k, a, b):
    def func(x):
        return -log(exp(-k*a) - x*(exp(-k*a) - exp(-k*b))) / k
    return func
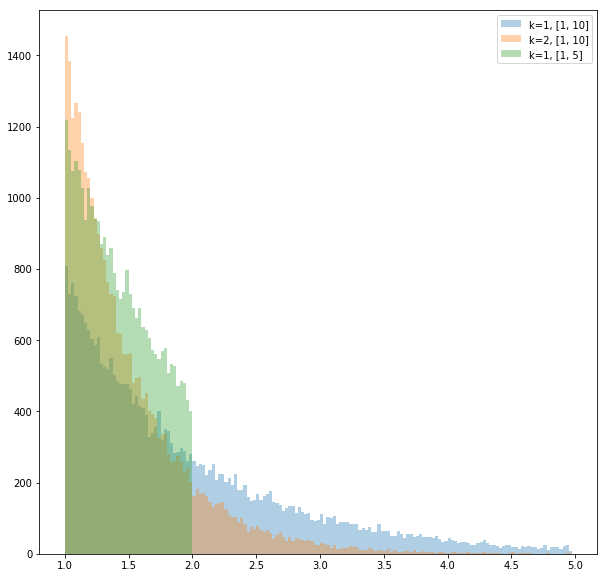
グラフは
fig, ax = plt.subplots(figsize=(10, 10))
bins = list(np.arange(1, 5, 0.025))
# k, a, bの値を変えて3つ描画する
ax.hist([RNG_exp(1, 1, 10)(random.random()) for _ in range(30000)], bins=bins, alpha=0.35, label="k=1, [1, 10]")
ax.hist([RNG_exp(2, 1, 10)(random.random()) for _ in range(30000)], bins=bins, alpha=0.35, label="k=2, [1, 10]")
ax.hist([RNG_exp(1, 1, 2)(random.random()) for _ in range(30000)], bins=bins, alpha=0.35, label="k=1, [1, 5]")
ax.legend()
fig
なお前の式で\(k=1\), \(b = \infty\) とすると
\[{\it cdf}^{-1}(x) = a \log(1-x)\]
となってかなり簡単になる。
その他
逆関数法を使って乱数が求められる分布は他にもあるが省略。
逆関数法を使わないでも乱数が求められる分布もある。
例えば、 \(X_{1}, \dots , X_{n}\) を \([a, b]\) の一様分布に従う変数としたとき
\[ X = max(X_{1}, \dots, X_{n})\]
とすると、 \(X\) は \({\it pdf(x) = cx^{n}}\) かつ \(X \in [a, b]\) な分布に従う。
このことは
\begin{align}
P(X = x) & = P(x_{1} \leq x \land , \dots , \land x_{n} \leq x) \\
& = \prod_{i=1}^{n} P(x_{i} \leq x) & (\because x_{i} は独立) \\
& \sim \prod_{i=1}^{n} x & (\because x_{i}は一様分布に従う) \\
& = x^{n}
\end{align}
からわかる。
逆関数法を使わないで乱数を求める他の方法として、ボックスミュラー法がある。
参考文献
Physically Based Rendering, Third Edition, Chapter13 “Monte Carlo Integration”
Ray Tracing: The Rest Of Your Life (Ray Tracing Minibooks Book 3), Chapter2 “One Dimentional MC Integral”
積分
\[
\int_0^{10} e^{-x^2}dx = 0.886227…
\]
を、計算で求めることを考える。
(近似値は wolfram alpha で計算した)
まず被積分関数と答えを定義する。
from math import exp
# 被積分関数
f = lambda x: exp(-x**2)
# 答え
answer = 0.886227
次にipython用の初期設定をする。
# 記事の中で使うのモジュールのインポート
%matplotlib inline
import random
from math import sin, cos, exp, log
import numpy as np
import matplotlib.pyplot as plt
区間分割
まず、
\begin{align}
& \int_a^b f(x) dx = \lim_{n \to \infty} \frac{b - a}{n} \sum_{i=0}^{n} f(a + (b - a)\frac{i}{n})
\end{align}
を使って値を求める。
def section_split(f, a, b, n):
  sum = 0
  for i in np.linspace(a, b, n):
    sum += f(i)
  return (b - a) / n * sum

# 誤差を求める
section_split(f, 0, 10, 1000) - answer
近い値が求められている。
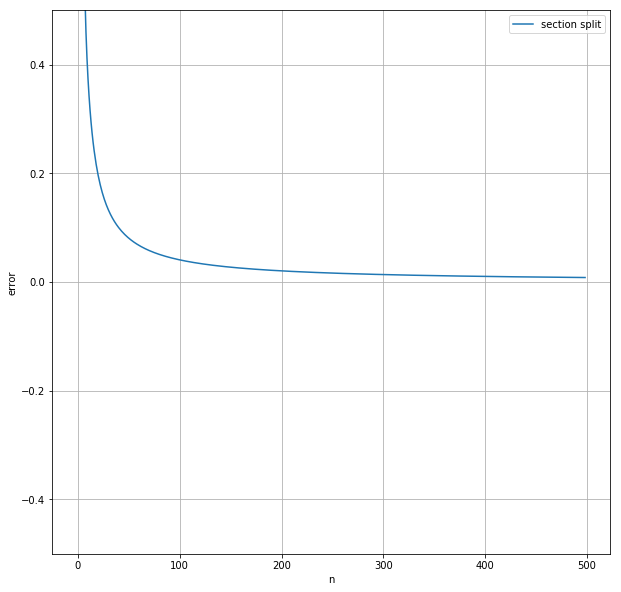
nと誤差の関係をグラフにプロットしてみる。
fig, ax = plt.subplots(figsize=(10, 10))
ax.hold(True)
ax.grid(True)
ax.set_xlabel("n")
ax.set_ylabel("error")
ax.set_ylim(-0.5, 0.5)
n = 500
ax.plot([section_split(f, 0, 10, n) - answer for n in range(1, n)], label="section split")
ax.legend()
fig
利点
- コーディングが簡単
- 近似の精度が(\(n\)に対して)良い
欠点
- 計算を途中で打ち切ることができない
- 変数の数が多い場合計算量が大きい
- \(k\)個の変数について\(n\)個の区間に分割した場合、積分する関数の計算は\(n^k\)回必要になる
- 同じ\(n\)に対して同じ値しか返さない
- 計算精度などの関係で\(n\)の上限が決まっているとき、精度の上限も決まってしまう。
モンテカルロ
関数に渡す値を順番に選ぶ代わりにランダムに取る方法。
def montecarlo(f, a, b, n):
    sum = 0
    ans = []
    for i in range(1, n):
        sum += f(random.uniform(a, b))
        ans.append(sum / i * (b - a) - answer)
    return ans
誤差の変化をさっき書いたグラフに上書きする。乱数を用いているので、何回か近似を行ってそれぞれについての誤差の変化をプロットする。
ax.plot(montecarlo(f, 0, 10, n), label="montecarlo", color="g", alpha=0.25)
for i in range(14):
    ax.plot(montecarlo(f, 0, 10, n), color="g", alpha=0.25)
ax.legend()
fig
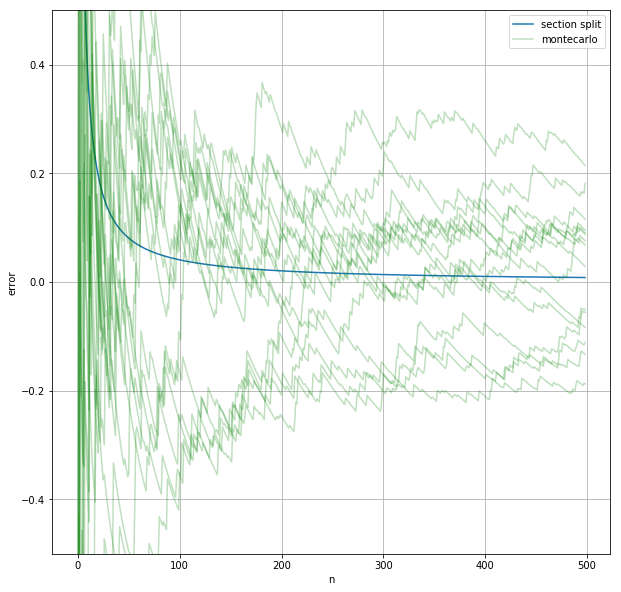
モンテカルロ法で近い値が求まっているが、区間分割法ほど精度が高くないことが分かる。
利点
- コーディングが(多変数の場合でも)簡単
- 途中で計算を打ち切れる
- 制限時間は10分だと言われれば10分全て使いきれる
- 粗い近似がすぐに求まる
欠点
- 近似の精度が悪い
- 関数の形によっては\(n\)を大きくしても精度がほとんど向上しないことがある
- 関数の一部だけが大きな値を取るときなど
- 今回の関数も多少当てはまる。誤差が突然大きくなったり小さくなったりしている点がグラフにいくつかある。
重点サンプリング
今考えている被積分関数\(e^{-x^2}\)は\(x=0\)の近くで大きな値を取り、\(x \geq 3\) の部分ではごく小さな値しか取らない。
fig2, ax2 = plt.subplots(figsize=(10, 10))
ax2.plot(np.linspace(0, 10, 100), [f(x) for x in np.linspace(0, 10, 100)], label="integrad")
ax2.legend()
ax2.grid()
fig2
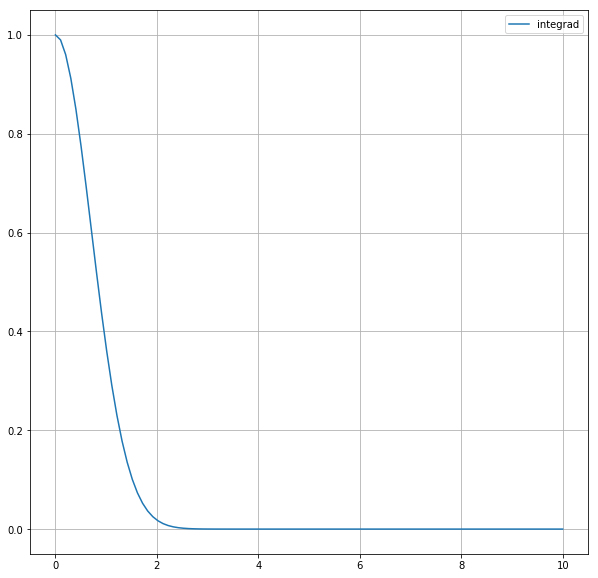
そのため\(x=0 \to 10\) の積分と \(x=0 \to 3\) の積分の値の差は小さい。つまり、モンテカルロ法で\(x=0 \to 10\)の積分を求めるとき、変数を\([0, 10]\)からとる代わりに\([0, 3]\) からとっても答えはあまり変わらない。
それどころか、そうしたほうが\(n\)の値が相対的に大きくなって近似の精度が良くなることが予想できる。
実際そうなることを確かめる。
fig3, ax3 = plt.subplots(figsize=(10, 10))

# [0, 10]から取る
ax3.plot(montecarlo(f, 0, 10, n), label="[0, 10]", color="g", alpha=0.4)
for i in range(14):
    ax3.plot(montecarlo(f, 0, 10, n), color="g", alpha=0.4)

# [0, 3]から取る
ax3.plot(montecarlo(f, 0, 3, n), label="[0, 3]", color="r", alpha=0.4)
for i in range(14):
    ax3.plot(montecarlo(f, 0, 3, n), color="r", alpha=0.4)


ax3.legend()
ax3.grid()
ax3.set_ylim(-0.5, 0.5)
fig3
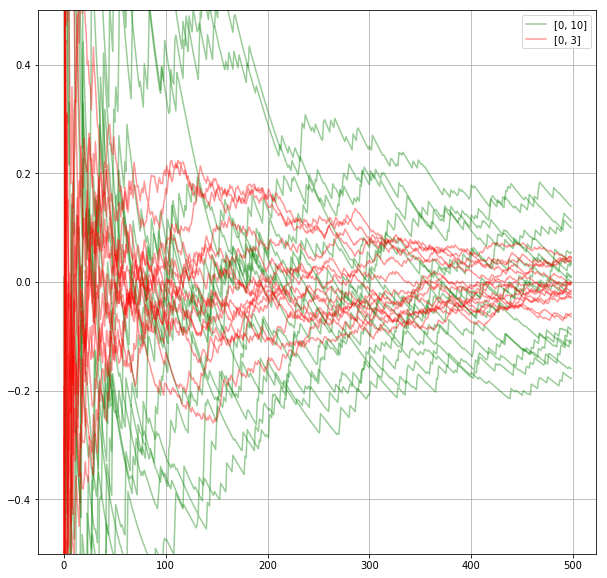
このことを一般化すると、「被積分関数が大きい値を取るところから変数を多くとったほうが精度が上がる」ことが分かる。つまり、完全に一様な分布ではなくて被積分関数と似た分布から変数\(x\)をとって\(f(x)\)を求める方が望ましい。
このことを実現するには、ある分布が与えられたときにその分布に従うような乱数を(無数に)出力する手続きが必要となるが、
これは別の記事で書くことにする( 書きました)。結論だけ書くと、「ある関数 \({\it pdf}(x)\)の不定積分とその逆関数が解析的に求まるならば、\(x\)が選ばれる確率が\({\it pdf}(x)\)に比例する乱数を一様乱数から作ることができる」となる。
以下の例では変数が \(x \in [0, 10]\) の値を取る確率が \( {\it pdf}(x) = e^{-x} \) に比例するようにしている。ここで \(e^{-x}\) を選んだのは、この関数が被積分関数に似ていて、かつ不定積分とその逆関数が簡単に求まるからだ。
\( {\it pdf}(x) \) は被積分関数と似ている方が良くて、被積分関数と同じなのが理想だ。しかし、\( {\it pdf}(x) \) として被積分関数を取れるなら、それは積分を解析的に求められることを意味するので数値で近似する意味がない。
pdf = lambda x: exp(-x) / (1 - exp(-10))        # pdf(x) : 自分で考える/正規化もする
cdf = lambda x: (1 - exp(-x)) / (1 - exp(-10))  # cdf(x) : pdf(x)を[a, x]で積分したもの
cdf_inv = lambda x: -log(1- (1 - exp(-10)) * x) # cdf_inv(x) : cdf(x) の逆関数

def importance_sampling(f, a, b, n):
    sum = 0
    ans = []
    for i in range(1, n):
        x = cdf_inv(random.random())
        sum += f(x) / pdf(x)
        ans.append(sum / i - answer)
    return ans

ax.plot(importance_sampling(f, 0, 10, n), label="importance sampling", color="r", alpha=0.25)
for _ in range(14):
    ax.plot(importance_sampling(f, 0, 10, n), color="r", alpha=0.25)
ax.legend()
fig
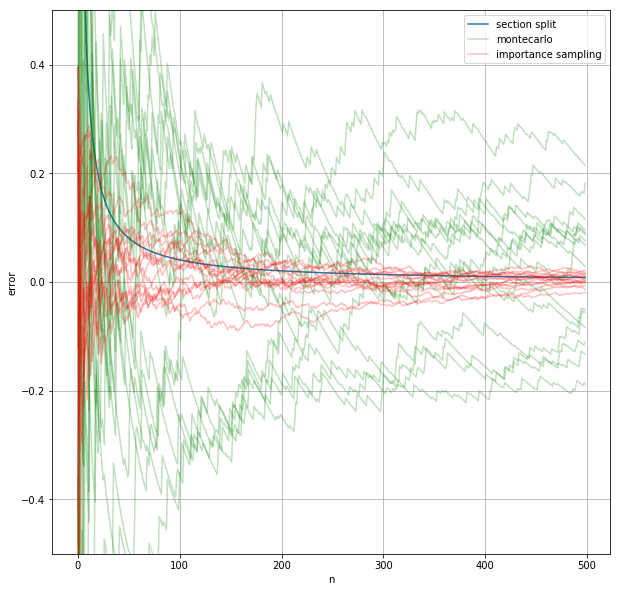
グラフより、一様分布を使ったモンテカルロ法と比べるとこの方法を用いた方が近似値のブレが少なく、近似値の精度も高まることが分かる。
参考文献
Physically Based Rendering, Third Edition, Chapter13 “Monte Carlo Integration”
Ray Tracing: The Rest Of Your Life (Ray Tracing Minibooks Book 3), Chapter2 “One Dimentional MC Integral”


